Google Analytics
The Google Analytics module enables you to retrieve analytics data in your Google Analytics.
Getting Started with Google Analytics
Prerequisites
-
A Google Analytics account – you can create one at www.google.com/analytics
-
A Universal Analytics property created (in order to obtain a View ID)
Note
The module dialog fields that are displayed in bold (in the Ibexa Connect scenario, not in this documentation article) are mandatory!
Connecting Google Analytics to Ibexa Connect
-
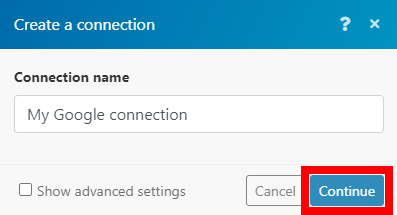
Go to Ibexa Connect and open the Google Analytics module's Create a connection dialog.
-
Enter a name for the connection to the Connection name field and click Continue.
After you click the Continue button, Ibexa Connect will redirect you to the Google website where you will be prompted to grant Ibexa Connect access to your account.
-
Confirm the dialog by clicking the Allow button.
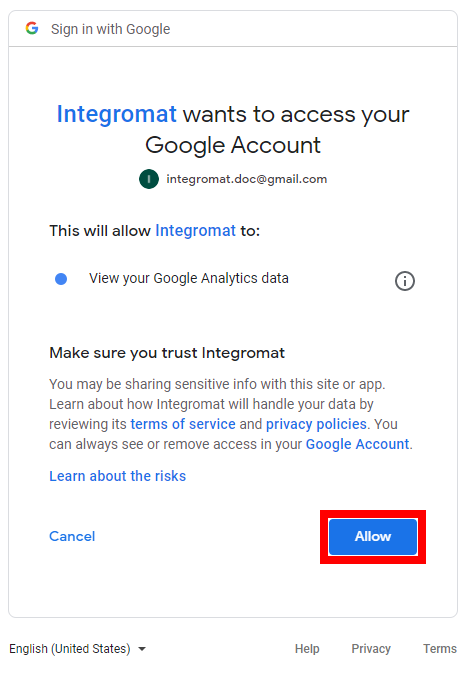
The connection has been established.
Note
Some adblocking browser plugins could block the Google Analytics app based on the Analytics keyword in the app. It is recommended to disable the plugins if you encounter such an error.
Actions
Get Analytics Reports
Retrieves the analytic data for the specified website.
| View ID | Enter the View ID. See How To Obtain a View ID section. |
| Sampling Level | Select the sampling level: * Default – Returns response with a sample size that balances speed and accuracy. * Small – Returns a fast response with a smaller sampling size. * Large – Returns a more accurate response using a large sampling size. But this may result in response being slower. |
| Date Ranges | Specify at least one date range you want to return results for. Note: When no date range is specified, no results will be returned. |
See the supported date and time formats.
Dimensions
Specify dimensions you want to include in the module's output. For example, the dimension ga:city indicates the city from which a session originates.
| Name | Enter the name of the dimension you want to include in the module's output. You can use the search button to find the correct name:  |
| Histogram Buckets | Enter the Histogram Buckets values. Useful, e.g., for the ga:hour dimension (object). Tip: For more details about Histogram Buckets, read the following article: bounteous.com/insights/2017/07/27/google-analytics-api-v4-histogram-buckets |
Dimension Filter Clauses
Add groups of dimension filters.
The dimension filter specifies the filtering options on a dimension. For more details about dimension filters, please refer to Dimension Filter documentation.
Metrics
Add metrics. Metrics are quantitative measurements. For example, the metric ga:users indicates the total number of users for the requested time period.
The metric filter clauses. They are logically combined with the AND operator. Metric filters look at only the first date range and not the comparing date range. Note that filtering on metrics occurs after the metrics are aggregated.
| Expression | Enter a metric expression in the request. An expression is constructed from one or more metrics and numbers. Accepted operators include Plus (+), Minus (-), Negation (Unary -), Divided by (/), Multiplied by (*), Parenthesis, Positive cardinal numbers (0-9), can include decimals and is limited to 1024 characters. For example, ga:totalRefunds/ga:users, in most cases the metric expression is just a single metric name like ga:users. Adding mixed MetricType (E.g., CURRENCY + PERCENTAGE) metrics will result in unexpected results. |
| Alias | Enter an alias for the metric expression is an alternate name for the expression. The alias can be used for filtering and sorting. This field is optional and is useful if the expression is not a single metric but a complex expression that cannot be used in filtering and sorting. The alias is also used in the response column header. |
| Formatting Type | Select how the metric expression should be formatted. |
Metric Filter Clauses
Set the metric filters.
Select the operator for combining multiple metric filters and add metric filters. For more details about metric filter, please see metric filters documentation.
Filters Expression
Enter a dimension or metric on which to filter, followed by the filter expression. For example, the following expression selects ga:browser dimension which starts with Firefox; ga:browser=~^Firefox. For more information on dimensions and metric filters, see Filters reference.
Order By
Set the sorting options.
Field Name |
Enter the field which to sort by. The default sort order is ascending. |
Order Type |
Select how the sort order is being determined. A detailed description of the options can be found in the GA v4 API documentation. |
Sort Order |
Select the sort order of the returned results. |
Segments
If you need the report to be segmented, define segments you want to return. You can create a new segment (a dynamic segment) or enter the ID of the existing segment to be used.
Pivots
Specify the pivot section. Please find the description of pivot fields in the GA v4 API documentation.
Cohorts
Add and specify cohorts – cohort is a group of users who share a common characteristic.
Please find the description of cohort fields in the GA v4 API documentation.
Lifetime Value
If the value of Lifetime Value is disabled:
-
The metric values are similar to the values in the web interface cohort report.
-
The cohort definition date ranges must be aligned to the calendar week and month. i.e. while requesting
ga:cohortNthWeekthestartDatein the cohort definition should be a Sunday and theendDateshould be the following Saturday, and forga:cohortNthMonth, thestartDateshould be the 1st of the month andendDateshould be the last day of the month.
When the Lifetime Value is enabled:
-
The metric values will correspond to the values in the web interface LifeTime value report.
-
The Lifetime Value report shows you how user value (Revenue) and engagement (Appviews, Goal Completions, Sessions, and Session Duration) grow during the 90 days after a user is acquired.
-
The metrics are calculated as a cumulative average per user per time increment.
-
The cohort definition date ranges need not be aligned to the calendar week and month boundaries.
Include Empty Rows
Enable to include rows if all the retrieved metrics are equal to zero. The default is disabled which will exclude these rows.
Use Resource Quotas
Enables resource based quotas, (defaults to False). If this field is set to True the per view (profile) quotas are governed by the computational cost of the request. Note that using cost-based quotas will higher enable sampling rates. (10 Million for SMALL, 100M for LARGE. See the limits and quotas documentation for details.
Make an API Call
Allows you to perform a custom API call.
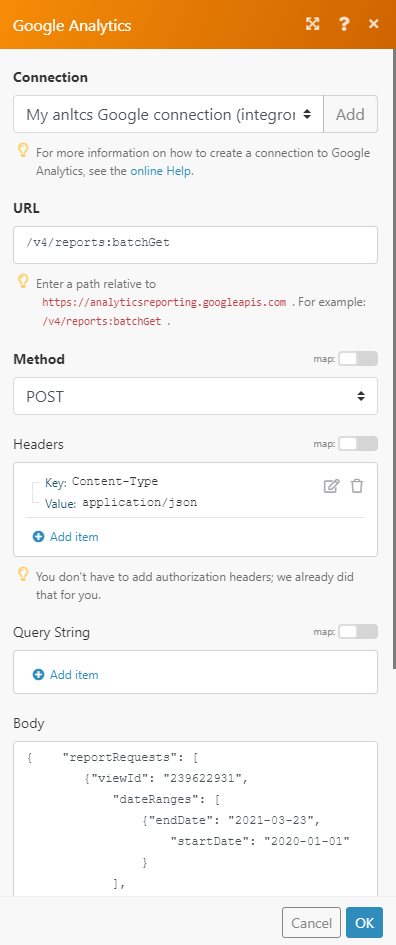
| URL | Enter a path relative to https://analyticsreporting.googleapis.com. For example: /v4/reports:batchGet.Note: For the list of available endpoints, refer to the Google Analytics v4 API Documentation. |
Method
Select the HTTP method you want to use:
GET to retrieve information for an entry.
POST to create a new entry.
PUT to update/replace an existing entry.
PATCH to make a partial entry update.
DELETE to delete an entry.
Headers
Enter the desired request headers. You don't have to add authorization headers; we added those for you.
Query String
Enter the request query string.
Body
Enter the body content for your API call.
Example of Use - Get Analytics Reports.
The following API call returns analytics reports within the date range and specified dimensions and in your Google Analytics account:
URL: /v4/reports:batchGet
Method: POST
Body:
1 2 3 4 5 6 | |
 |
The result can be found in the module's Output under Bundle > Body > reports. In our example, the report data were returned:
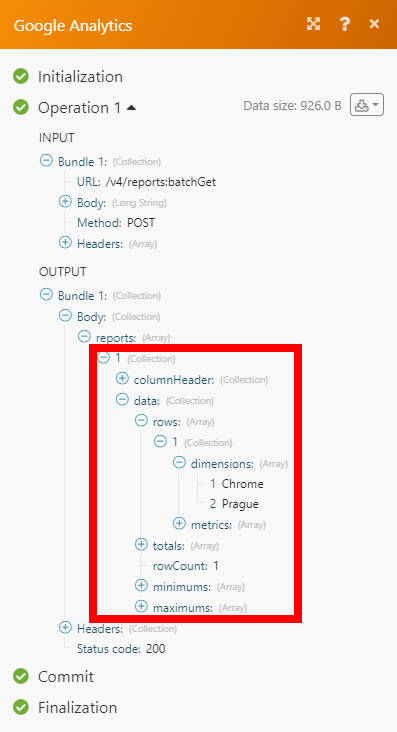 |
How To Obtain a View ID
-
Log in to your Google Analytics account.
-
Navigate to the Admin page and click +Create Property button.
-
Fill in the property details, click Show advanced options (
 ) and enable the Create a Universal Analytics property option.
-
Enter your website URL and finish setting up the property – see GA documentation for further details.
-
Switch to the Universal Analytics property (UA-XXXXXXXXX-2).
-
Open View Settings and copy the View ID.
Note
Use the tracking tag from your Universal Analytics property (UA-XXXXXXXXX-2), not from your GA4 property.