3. Dashboard
The administration dashboard is the entry point to configure and control the Personalization Solution. It is split into two main sections:
- The top section contains diagrams representing statistical information on how the recommendation engine is used and how successful - depending on the KPIs - recommendations are.
- The lower section is made up of many configuration tabs. It contains at least the Scenarios and Added revenue information. Depending on the license and registration information there is also a tab for Plugin and Content Import settings.
Statistics
The diagram part consists of three main blocks:
- Collected events: The input data (clicks, buy, clickrecommended, ...) which is going into the recommendation engine for the customer website (see 4. Event Types for more information).
- Recommendation calls: The number of recommendation calls (total and per scenario)
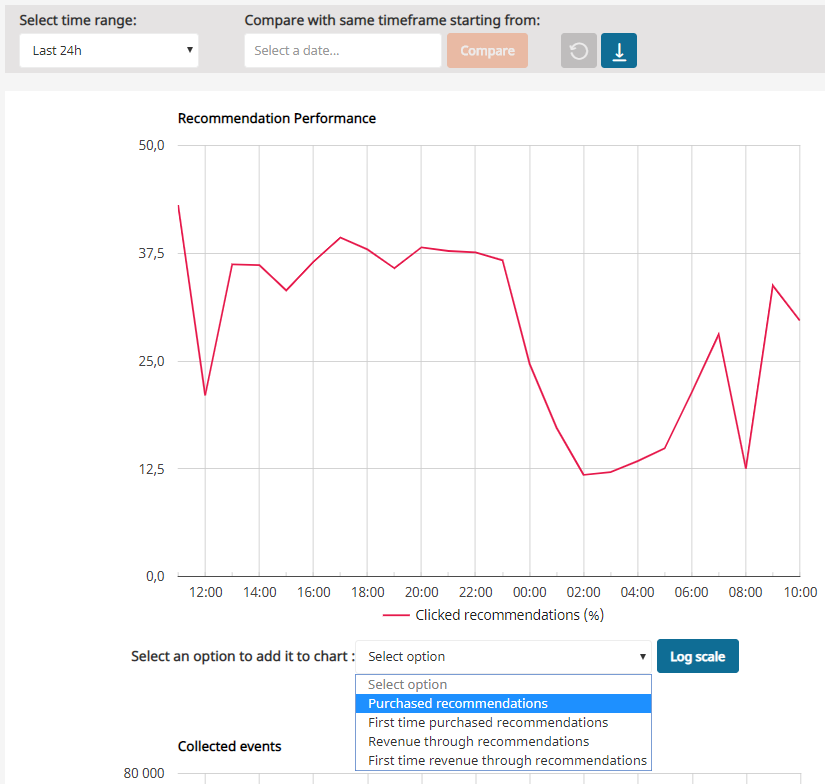
- Clicked recommendations, Purchased recommendations and Revenue by recommendations: The effectiveness of recommendations regarding clicked recommendations, revenue through recommendations and absolute number of converted/sold recommendations
The conversion (or click-through) rate is an indicator of the acceptance and therefore the quality of recommendations. It is calculated as follows: The total number of clicked recommended products divided by the amount of recommendation calls. This statistic only delivers reliable information if the tracking is implemented correctly.
The revenue-through-recommendations is a monetary value which was additionally created by recommendations. It is calculated as follows: If a user buys product A and has clicked on it as a recommendation within 30 minutes before we assume it was sold through a recommendation.
Purchased recommendations is the plain number of sold recommendations without any revenue/price information.
All statistical information can be downloaded in MS Excel format. The timeframes depend on the selection of the diagram period (day, week, month, 3 months and year) but can also be customized.
Configuration Settings
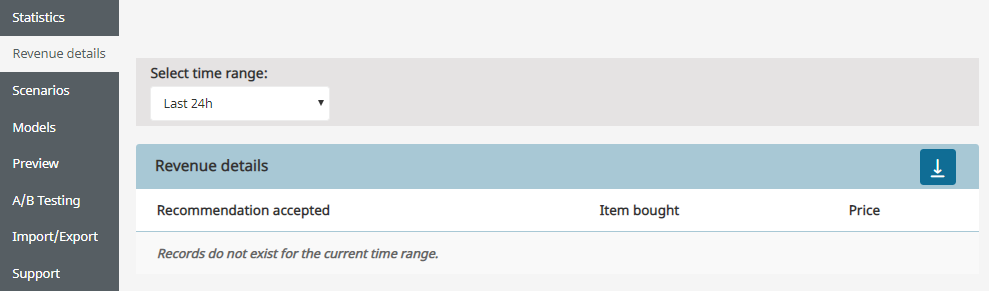
Revenue details
This tab shows you when recommendations were bought and how much time passed between the click on the recommendation and the buying event.
Scenarios
The scenario overview shows all available scenarios. Additional info like a description and the delivered recommendations in the selected timeframes are also presented.
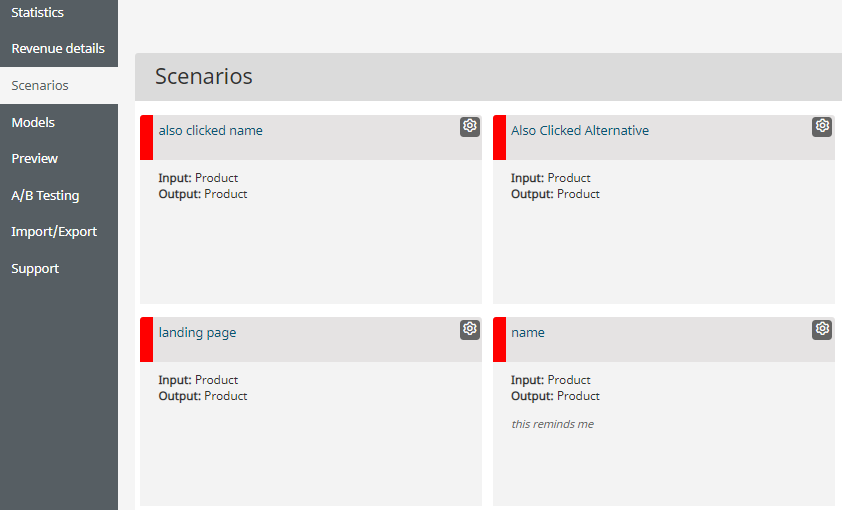
Scenarios with green status bars indicate that all models can provide recommendations. Yellow bars indicate that only a part of the configured models can provide recommendations and red ones indicate that no recommendations can be delivered. See 8. Scenarios.
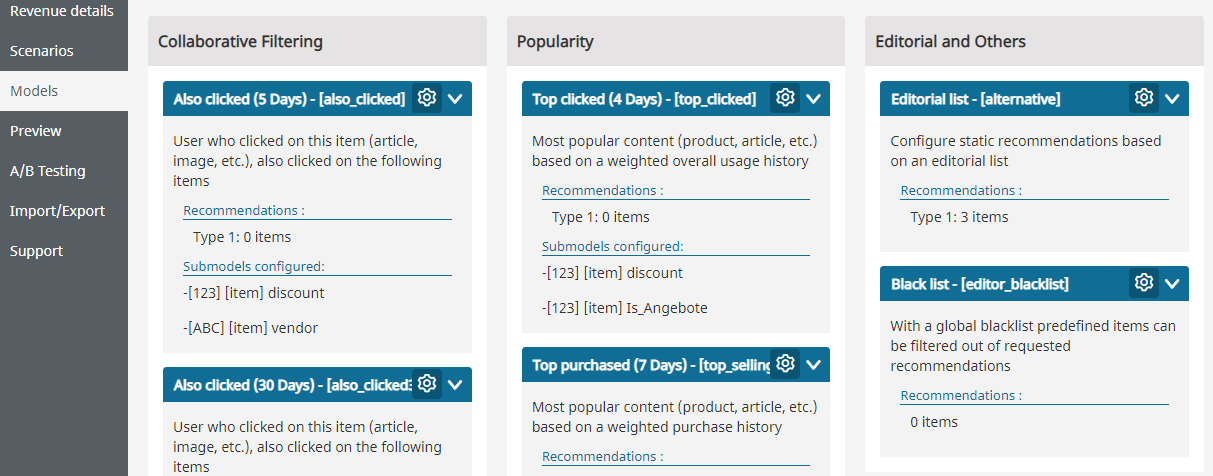
Models
This tab allows you to see all available models and configure them, see 6. Recommendation Models
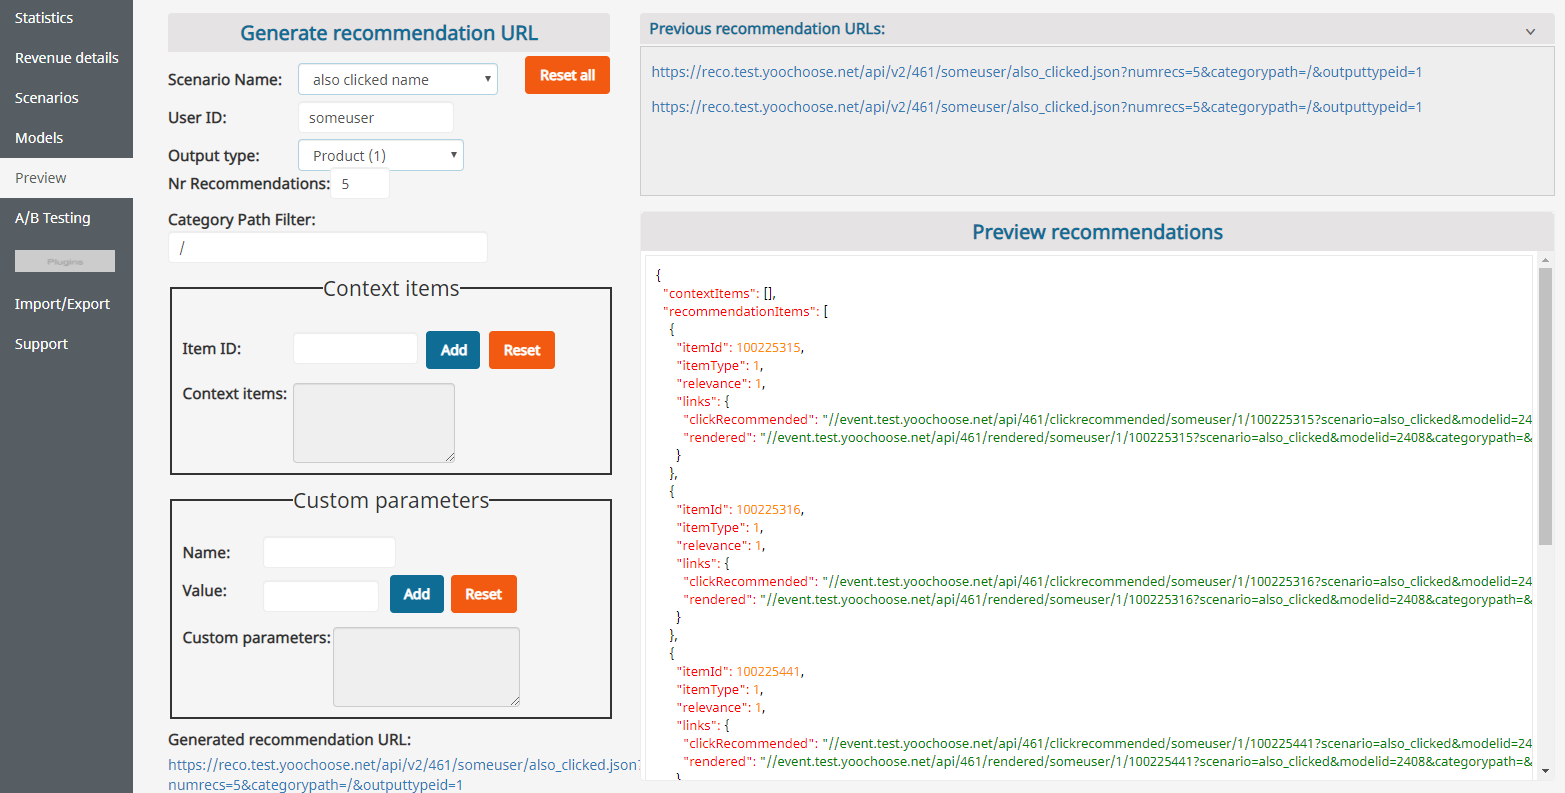
Preview
This tab shows you recommendation preview based on a Scenario.
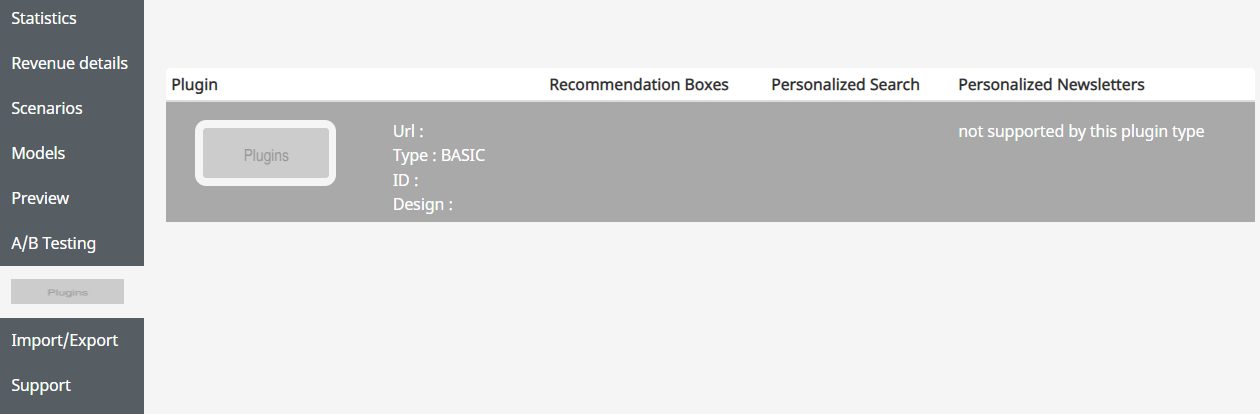
Plugins
If a plugin was used to register the service, specific settings can be configured under Plugins.
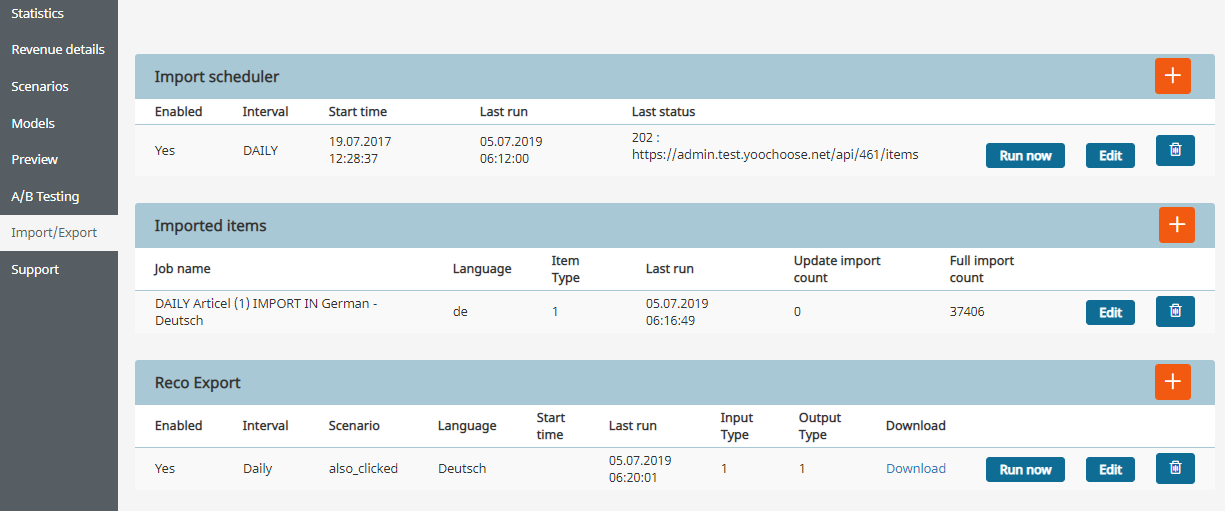
Import/Export
Item import jobs are used to fetch data from a customer system. Data-mappings and schedule times are defined here.